Running multiple versions of nodejs and npm on windows
I use NVM to run different versions on node on my Ubuntu development machine. So, when i wanted to do the same on my windows development machine, i was out of luck since NVM does not support windows. But nodejs is available for windows as just a downloadable .EXE file. This means that i can just include the required version of the tiny binary file in my projects and i should be good to go. Well, the ride got a little bumpy along way and am hoping that this post will help someone trying to do the same.
So, now that i had my node.exe in my project, the very first thing i wanted to do was to use NPM to install dependencies. How do I go about doing that? Well, i could download NPM as ZIP files from it’s releases on github. So, where do we put it? I had to created a “node_modules\npm” folder alongside the node.exe and extract the contents of the “npm-x.x.x” folder inside the npm zip file download into this folder. That’s not all, copy the files named “npm” and “npm.cmd” from the “node_modules\npm\bin” directory to the same directory as node.exe. Now, you should be able to use both nodejs and npm from the command line while referring to their qualified paths. Remember node and npm have installed in that project only and not globally. Invoke “npm install” and the dependencies in your packages.json should be installed into your local “node_modules”. Sounds like we have achieved our goal.
Great, we got everything working locally and checked in. The build server should be able to check it out and call the local npm and install all the project dependencies locally. Well, for me, things blew up on the build server. Why? NPM was having trouble with installing the node-sass package. This turned out to be a native dependency. The reason why everything worked on my machine but ended up failing on the build server was because I had VisualStudio 2015 installed on my development machine and it wasn’t installed on the build server (neither should it be IMHO). That is, my development machine had a C++ compiler available and the build server did not. This took me back to the days when I used to have the same exact problems with installing PyPI packages on windows machines. But, the Python community had already solved this problem using pre-built binaries in wheels distributions. BTW, if you are working in GIS & Python on windows, Christoph Gohlke has a treasure trove for you here. Most of the consensus in online discussions seemed to be to install VisualStudio 2015 on the build server. But there is a glimmer of hope, Microsoft has recognized the issue and has made the Visual C++ Build Tools 2015 available exactly for this purpose (standalone c++ tools for build environments). You will also need to install Python 2.7 on the build server. The build server can run some scripts to configure the environment before it builds these native dependencies. First off, it needs to add Python to its PATH and configure NPM to use Python 2.7 with the following command
npm config set python python2.7
The Microsoft C++ build tools version can be set globally with this command
npm config set msvs_version 2015 –global
But, we can also set the C++ build tools version when like NPM install like shown here
npm install –msvs_version=2015
After all that, things should get working. I am hoping that this gets easier in the future if NPM moves to a Python wheels like pre-built binary ditribution for native dependencies.
Raster statistics + SIMD === winning
Recently, the .NET framework 4.6 enabled features that would allow us to leverage SIMD (Single Instruction Multiple Data) capabilities that have been present in our CPUs since the 2000s and deliver faster performance for calculating raster statistics.
We were using the .NET bindings for GDAL to calculate a few simple raster statistics for reporting needs. I got curious as to the kind of performance boost that we could be seeing if we leveraged SIMD for this purpose. So, I created a little console app to explore the performance gains. Here is what i observed.
To start off, we need to check if our CPU supports SIMD instructions. Although, I expect that everyone’s computer will support SIMD, here is simple way to check. Download and run CPU-Z. Keep an eye out for the SSE instructions as shown below.

Clone the git repo or just download the executable from here. And run the SIMD.exe file with a GeoTIFF file as a parameter. Needless to say, the console app is pretty rudimentary and was written solely to observe SIMD performance gains. I would highly encourage you to clone the repo and explore further if you are interested. The app currently just reads all the raster image into memory and sums all the values to produce a total sum. Not very useful, but i am hoping it can get you started in the right direction to explore further. The amount of code required or in other words to modify your current app to leverage should be manageable and shouldn’t require a complete rewrite. Also, currently the SIMD support in the .NET framework only works under 64-bit and in release mode. That had me stumped for a bit. But, there is very useful “IsHardwareAccelerated” Flag that helps you find out if your vectorized code is actually reaping the benefits of the SIMD hardware.
Raster X size: 28555
Raster Y size: 17939
Raster cell size: 512248145
Total is: 146097271
Time taken: 4568
SIMD accelerated: True
Another Total is: 146097271
Time taken: 1431
Here is the result from a run on a sample raster image. With the SIMD vectors, the execution went from 4568 to 1431 milliseconds. That’s almost 1/3 of the original time. Pretty tempting isn’t it?
The performance measure doesn’t really prove anything and is purely meant to satisfy my own curiosity. Your mileage may vary. To eek out any gains out of using SIMD vectors, you will need to be processing a large enough array that will justify the overhead of creating the SIMD vectors.
I realize that pretty much everything needs to be available in JavaScript to be relevant these days 🙂 So, if JavaScript is your cup of tea FireFox has experimental support for SIMD vectors. Soon we will be running raster statistics on the browser. Actually, we currently are running some raster statistics but without the SIMD bits. Hopefully, i will get around to writing about that soon.
TableauShapeMaker – Adding custom shapes to Tableau maps
Hello fellow map herders, I recently wrote this little utility that can convert shapefiles into a CSV format that is consumable by Tableau. Tableau has a collection of built-in shapes that are sufficient for most mapping needs inside Tableau. But sometimes, there are valid reasons for wanting to add custom lines or polygons on to the Tableau map. This utility processes a shapefile in any coordinate system and optionally simplifies the shapes to reduce the number of vertices being displayed and outputs a CSV file that can be consumed by Tableau and blended with other data sets to produce the required visualization.
Options:
-h, -?, –help Show this message and exits
-i, –input=VALUE (Required) Input shape file in any geographic or projected coordinate system
-o, –output=VALUE (Optional) Output CSV file name
-t, –tolerance=VALUE (Optional) Tolerance value to use for simplifying the shape.
Example command
TableauShapeMaker.exe -i “C:\VA_JURIS.shp” -o juris.csv -t 0.001
The utility can handle displaying multi-part polygon/line shapes like the Hawaiian islands properly. But the utility cannot handle converting holes in polygons. This is due to the fact that I could not find information on how to represent them in the Tableau format. If anyone can help me with the representation for holes, I can add that feature to the utility also.
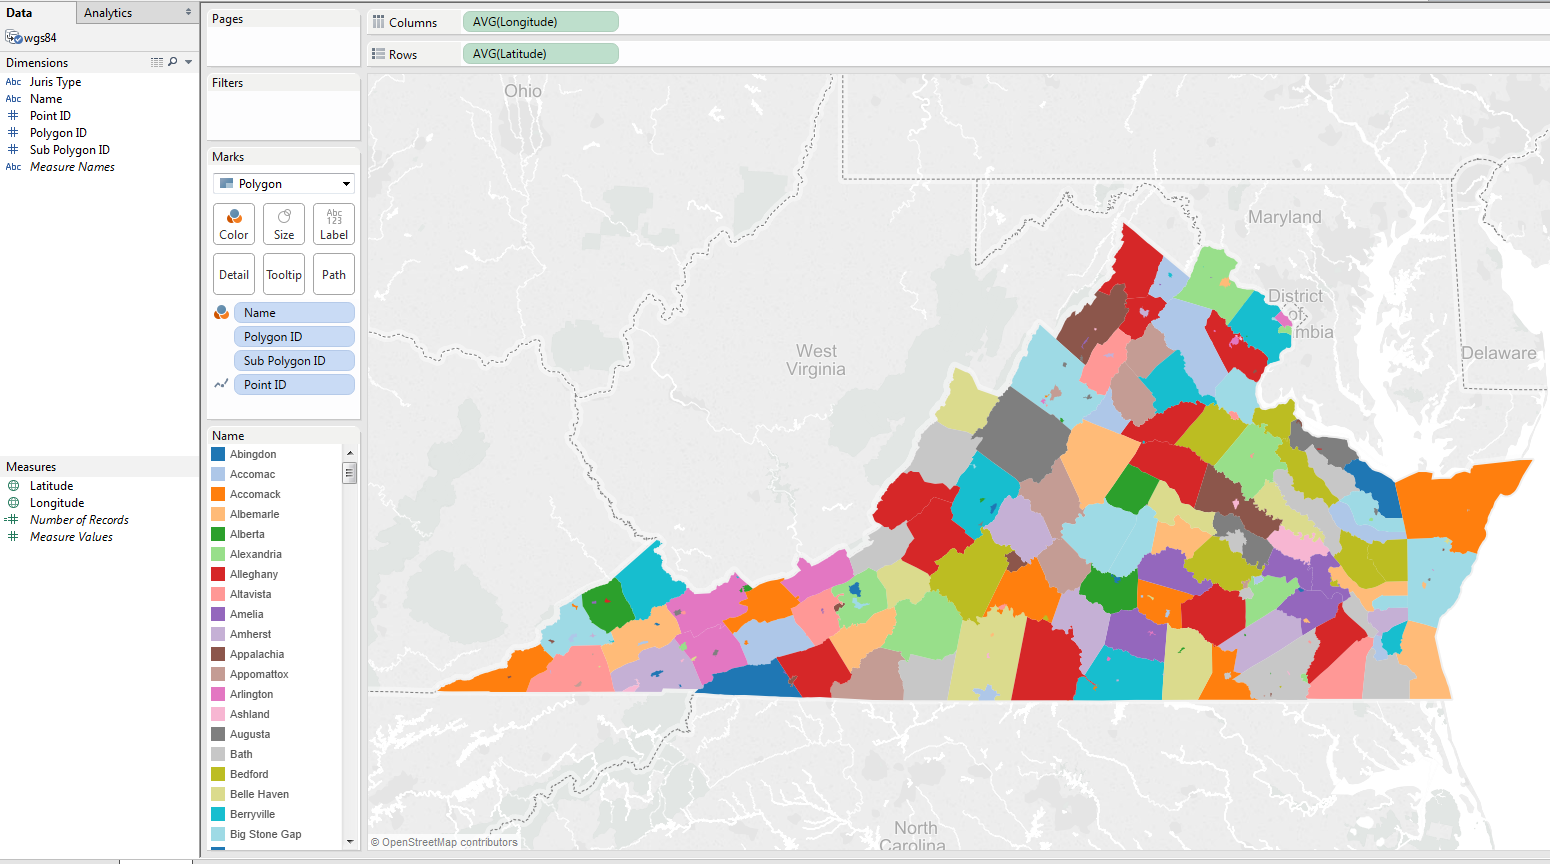
To display the shapes in the generated CSV file on the Tableau maps, add the CSV file as a data source in Tableau. The “Latitude” and “Longitude” fields should be identified as “Measures”, if not please mark them as such. The “Point ID”, “Polygon ID” and “Sub Polygon ID” fields should be identified as “Dimensions”. Double click the “Latitude” and “Longitude” measures to add them into the row and column shelves. Select “Polygon” from the “Marks” drop down. Drag the “Point ID” dimension to the “Path” shelf followed by the “Polygon ID” dimension to the “Detail” shelf and the “Sub Polygon ID” dimension to the “Detail” shelf. This should display the shapes on the map. To color the shapes by a certain dimension, say “Name”, drag the “Name” dimension to the “Color” shelf.
Since, holes are not supported by TableauShapeMaker, you will need to ensure that the smaller shapes are on top of the larger shapes ONLY IF they can be on top of each other. The shapes drawing order can be controlled/rearranged by dragging their legend entries to the right position in the legend list.
Obligatory screenshot…
Even though talking about ‘big data’ is the hipster thing to do, let’s talk about ‘large data’ (spatial)
First things first, ‘large data’ is something that I made up for lone sake of discussing spatial data where the individual shapes in every record are by themselves huge 🙂 . Data of this sort pose their own unique problems, even though, these issues are solvable with a little bit of ingenuity. The ‘big data’ problem is much harder to solve and seems to be getting a lot of attention lately.
Some examples of this data is US state boundaries, county boundaries etc. The size of the individual state shapes in the US state boundary dataset that has not been generalized (or simplified) can by themselves be formidable. The size of the state shapes is generally much bigger for the coastal states than for the land locked states. In one of the states boundary datasets I am working with, the size of Alaska’s state shape serialized to JSON by itself was close to 5 MB. Pushing such large data as-is to the client will just slow down the loading and rendering of web maps. And there are also other datasets like eco-regions etc where the individual region shapes are just the union of a multiple state shapes.
As you can guess, the size of the eco-regions shapes are also rather large. Such datasets create problems on multiple fronts. Because of the sheer size of these shapes, they need to generalized before they can be sent to the client (browser) for display purposes. Generalizing such shapes will use up a chunk of your CPU time, so these generalized shapes really to be cached to allow your app to be scalable. Caching such static datasets with such large shapes shouldn’t be too much of an issue but it is something that needs to be additionally done to handle the largeness of the shape 🙂
Another issue posed by the large datasets is with respect to the spatial operations that need to be done using them. Spatial indexes in databases make simple spatial operations like point-in-polygon really fast even against a large and complex polygon shape. But calculating the intersections of two or more large and complex polygons can still be a CPU intensive operation that takes a while. For example, if we have a couple of large datasets like let’s say eco-regions and watersheds, finding all forest stand areas that lie within eco-region ‘A’ and watershed area ‘2’ can still be a time-consuming operation as determining if an area completely lies within other large shapes is more time-consuming than checking if it intersects. And for more complex spatial operations that span across multiple large datasets, the number of CPU cycles needed increases drastically.
Most databases these days like MS SQL Server, Oracle, PostGIS all come packaged with really great spatial data types and spatial operation capabilities that makes the lives of application developers much easier. Saying that these databases have greatly simplified things would actually be an understatement. For transaction processing applications, the databases should be highly available, should be very fast, scale and support multiple concurrent users. But here comes the dilemma, if we perform such taxing spatial operations in the database, the spatial operations will use all the CPU cycles and keep the CPU utilization at 100% for the duration of the spatial operation. This means that other requests coming into the database will either be processed slower since they have to wait for the spatial operation to free up some CPU cycles or just timeout because the database has been unavailable for too long. This is not a good thing to have happen to an online transaction processing database. One other huge culprit here is also the serialization or de-serialization of large geometries into WKT/JSON/WKB to get shapes in and out of the database. Some databases MS SQL Server provide CLR data types that eliminates the need for serialization/deserialization, for other databases you might be out of luck based on the technologies you have to use. So, yes these ST_GeomFromText, ST_GeomFromGeoJSON, ST_AsGeoJSON are amazingly useful, but it is good to be aware of the side effects.
With good caching solutions, a lot of the problems described here can be alleviated, but they are problems nonetheless and don’t make your life easier 🙂 Let me know your thoughts…
Something to consider before using a relational storage as a service for your app
If you are planning on using any one of the great services available these days that let you store, retrieve, update and delete (perform CRUD operations) your relational data (geographic or not) using a HTTP API, here is something that you might need to consider. There are multiple services that allow you to do this these days. Some of these services are Google FusionTables, ArcGIS Online, CartoDB, ArcGIS Server 10 and up etc. Even though the backend storage for Google FusionTables is not relational, the service presents a relational facade to user by allowing tables to be merged etc.
All these services allow you to perform CRUD operations on your data over HTTP. This makes things really easy for front end developers since they can perform CRUD operations right from javascript and maybe just using the web server as a proxy relaying requests to the storage service.
But one of the things it takes away from us is the ability to perform multiple CRUD operations as one atomic unit. That is, let us assume that we have a polygon layer in our ArcGIS Server map service which also contains a table which contains attribute data related (one to many) to the polygon layer data. In this case, if one of our requirements is to update attribute data in a single polygon layer table row AND one or more rows with related data in the standalone attribute data which either succeed or fail together as a unit, then this becomes very hard to accomplish (if it is possible to do so). That is, we could end up with cases where the polygon layer table does get updated, but the update operations on the related table fails due to one of many possible reasons. This may allow bad data to be stored in the database with loss of data integrity.
Non-relational storage services are more resistant to this drawback since the data structure design for those databases expect us to handle this during design based on how the app uses the data being stored.
If you have any thoughts or suggestions on this issue, please leave a comment.
Using client side routing in web mapping applications
Thought I would share how I have been using client side routing in a web mapping application that I have been working on for a little while now. The application is coming along nicely and I have been having quite a blast writing CoffeeScript for the app. If you haven’t looked into CoffeeScript yet, please consider doing so. I found it to be very very helpful.
But CoffeeScript is not the point of this post. There are a lot more resources out there on the web to help you pick up CoffeeScript. Client side routing is something that I have been doing with backbone.js. backbone.js is a neat little library that helps users build cleaner web apps by encouraging the MVC style development in web pages. backbone.js might seems a little intimidating at first but if you stick with it, you will find it very helpful. Although, I wouldn’t suggest using backbone.js for simple web pages. It is mainly targeted towards single page web apps where you are writing a lot of javascript and updating only some sections of the web page based on ajax requests.
Speaking of single page web apps, i think a lot of web based mapping apps fall in that bucket, especially since a lot of GIS users expect to see all their favorite ArcMAP functionality in their web apps also. That is a battle that I have been fighting for a while now and have a sneaky suspicion that there is a long way to go. Although, I should mention that I have been able to push a ‘workflow driven app’ over ‘map driven workflow’ a little bit further along than I have been able to do in my earlier projects. The feedback so far has not been too shabby either. As far as I can tell, no user has reported the ‘Map Toolbar’ missing 🙂
The client side routing techniques uses the hash tag to refresh sub sections of a web pages optionally thru AJAX and without the need for a full page postback. Ok, so, what does all this stuff have to do with web mapping apps? Well, I am leveraging the client side routing technique to allow users to select features on the map via the URL. Hopefully, the screenshots below will shed more light on it

The above screenshot shows the URL in the browser address bar reflecting the selected feature on the map. The URL in the address bar reads “…/StewardshipPlan/18701/Stands#/Stand/1904”. The initial “…/StewardshipPlan/18701/Stands” portion of the URL indicates the page that is currently loaded by the browser. The page contains the map that the user can interact with. The latter “#/Stand/1904” portion of the URL is the client side route and allows backbone.js to call our javascript that triggers the selection of the feature on the map. The selected feature on the map and the client side route of the URL in the address bar is synchronized. That is, the user can type in the URL in the address bar and the page will open up with the stated feature selected on the map, or the user can browse around the map and select other features by clicking them and the client side route will update to reflect the current feature selection. Here is another screenshot with another feature selected

That is a neat trick, but what does it buy me? Well, for starters, you can email around URLs for features to the people you are collaborating with and when they browse to the link, they will arrive at the specific feature itself on the map and with it’s attribute window open and ready for editing it needed. Also, not sure how useful this is, but if you want to go back to your previously selected feature, just click te browser back button. But as a developer, building my app this way helped me get rid of a lot of gluey jquery event binding to button click events and replace them with just links on the page which trigger the right javascript via client side routing. Also, it almost forces me to write modular javascript which is very important for maintenance.
I have taken this line of thought a little further out and have enabled our split and merge functionalities to be routable too. Check the screenshots


The Merge and the split URLs perform the right feature selection and enable all the right map tools when the user navigates to the URL shown in the screenshots.
This is the first time I have used client side routing to build web mapping features like the ones described above. So far, i would say that it has worked out pretty good from a developer’s perspective. Any thoughts/suggestions about it is welcome and would be appreciated.
MBTilesViewer
I also created this bare bones MBTiles cache viewer to view the tile cache in MBTiles format. This application does not do much, just display the tilecache on a map. To view a MBTiles file, just fire up the viewer and start dragging and dropping MBTiles cache files on to it. You can drag and drop multiple MBTiles cache files at the same time if needed. And also, you can create MBTile caches with the TileCutter. The viewer was created using the ESRI WPF map control. If you would like to see this viewer do more, let me know 🙂
TileCutter update – With support for OSM and WMS map services
I just added support for creating MBTiles caches for WMS map services and also to download OSM tiles into the MBTiles format. MBTiles cache for WMS map services would improve map rendering performance, but why did i add support for OSM tile sets? Well, they will come in handy for disconnected/offline use cases. So, here are some usage examples
ArcGIS Dynamic Map Service:
TileCutter.exe -z=7 -Z=9 -x=-95.844727 -y=35.978006 -X=-88.989258 -Y=40.563895 -o=”C:\LocalCache\ags.s3db” -t=agsd -m=”http://server.arcgisonline.com/ArcGIS/rest/services/I3_Imagery_Prime_World_2D/MapServer”
WMS Map Service 1.1.1:
TileCutter.exe -z=7 -Z=9 -x=-95.844727 -y=35.978006 -X=-88.989258 -Y=40.563895 -o=”C:\LocalCache\wms111.s3db” -t=wms1.1.1 -m=”http://sampleserver1-350487546.us-east-1.elb.amazonaws.com/ArcGIS/services/Specialty/ESRI_StateCityHighway_USA/MapServer/WMSServer”
WMS Map Service 1.3.0:
TileCutter.exe -z=7 -Z=9 -x=-95.844727 -y=35.978006 -X=-88.989258 -Y=40.563895 -o=”C:\LocalCache\wms130.s3db” -t=wms1.3.0 -m=”http://sampleserver1-350487546.us-east-1.elb.amazonaws.com/ArcGIS/services/Specialty/ESRI_StateCityHighway_USA/MapServer/WMSServer”
OSM:
TileCutter.exe -z=7 -Z=9 -x=-95.844727 -y=35.978006 -X=-88.989258 -Y=40.563895 -o=”C:\LocalCache\osm.s3db” -t=osm -m=”http://tile.openstreetmap.org”
And always just type “TileCutter -h” for usage information.
Want to customize the parameters with which the maps are being generated? Just use the “-s” command line option ans specify the setting in a query string format.
TileCutter.exe -z=7 -Z=9 -x=-95.844727 -y=35.978006 -X=-88.989258 -Y=40.563895 -o=”C:\LocalCache\ags.s3db” -t=agsd -m=”http://server.arcgisonline.com/ArcGIS/rest/services/I3_Imagery_Prime_World_2D/MapServer” -s=”transparent=true&format=jpeg”
Also, if some of the tile requests result in errors, the level, column, row and error message information would be logged into a text file in the same directory as the MBTiles cache.
And now, for the best new feature of TileCutter, the program does not store duplicate tiles. That is, if the area you are caching has a lot of empty tiles in the ocean etc, the MBTiles cache created by TileCutter will only store one tile for all those duplicated tile images. Should help save disk space 🙂
TileCutter – A small utility to generate tile cache in the MBTiles format from ArcGIS Dynamic Map Services
Thought I would share a little utility I had written up to generate tile caches in the MBTiles format for ArcGIS Dynamic Map Services. The MBTiles cache format is very simple and makes moving caches between machines very easy since you just have to transfer one file instead of the thousands of files that need to be copied for normal tile caches. The TileCutter is a console utility and accepts the scale range and the extent in latitude/longitude for which the cache should be generated. It also takes a few other options listed below.
Options:
  -h, --help                 Show this message and exits
  -m, --mapservice=VALUE     Url of the ArcGIS Dynamic Map Service to be
                               cached
  -o, --output=VALUE         Location on disk where the tile cache will be
                               stored
  -z, --minz=VALUE           Minimum zoom scale at which to begin caching
  -Z, --maxz=VALUE           Maximum zoom scale at which to end caching
  -x, --minx=VALUE           Minimum X coordinate value of the extent to cache
  -y, --miny=VALUE           Minimum Y coordinate value of the extent to cache
  -X, --maxx=VALUE           Maximum X coordinate value of the extent to cache
  -Y, --maxy=VALUE           Maximum Y coordinate value of the extent to cache
  -p, --parallelops=VALUE    Limits the number of concurrent operations run
                               by TileCutter
  -r, --replace=VALUE        Delete existing tile cache MBTiles database if
                               already present and create a new one.
Example Usage:
To just try it out, just run TileCutter.exe, it will download tiles for some default extents from an ESRI sample server
TileCutter -z=7 -Z=10 -x=-95.844727 -y=35.978006 -X=-88.989258 -Y=40.563895 -o=”C:\LocalCache” -m=”http://sampleserver1.arcgisonline.com/ArcGIS/rest/services/Demographics/ESRI_Population_World/MapServer”
The TileCutter does request tiles in parallel threads and allows to you controls the number of concurrent operations. I don’t want to write too much about it yet since i am still working to add more capabilities to it. I am planning on providing the ability to generate MBTile caches for WMS services, OSM tiles etc in the future and more if there is interest. Also, planning on implementing a way to avoid storing duplicate tiles(for example, empty tiles in the ocean etc). I just wanted to get the tool out there early to get feedback and guage interest. So, if you have queries/interest/feature requests, let me know 🙂
Also, I will blog about a little piece of code for a IHttpHandler that will serve up the MBTiles to web clients pretty soon. Stay tuned…
Moving away from the javascript module pattern
A while ago I had written about using the javascript module pattern to organize code a little better. But off late, I have moved away from using the module pattern because of some reasons which i will outline below. But the pattern to use is really a matter of preference in my opinion. I have now gone back to basics and am using the javascript prototype pattern and have been loving it. Here is why i made the switch
- the ‘this’ keyword in my class method means what I really expect/want it to mean
- creating multiple instances of my class doesn’t consume more memory for creating more function instances since all instances use the functions on the prototype
- the ‘instanceof’ operator can be used to determine if any object is an instance of the class
Here is a simple example illustrating how to create a class. The snippet below creates a class called ‘MyClass’ with the ‘getOption’, ‘calculatePay’, ‘getDisplayPay’ methods.
function MyClass(options) {//constructorthis.options = options; }; MyClass.prototype.getOption = function(name) { return this.options[name]; }; MyClass.prototype.calculatePay = function(hours) { return hours * this.options['hourlyRate']; }; MyClass.prototype.getDisplayPay = function(hours) { return this.getOption('name') + " - " + this.calculatePay(hours); };
To create an instance of the class above
var inst = new MyClass({‘name’ : ‘Jeff’, ‘hourlyRate’ : 1000});
Also, the following works too
inst.constructor === MyClass; //returns true
if( inst instanceof MyClass ) //evaluates to true
Pretty simple and sweet. Here are a couple of examples of classes written like above
I am also using the standalone YUITest for unit testing javascript which doesn’t require the YUI framework which looks more attractive in YUI3. It was a very close call between YUITest and QUnit for the unit testing framework. I went with YUITest because it came with Selenium drivers
 Subscribe
 Follow Me
 Contact me
2 comments